Reader-supported: no affiliate links active yet — our rankings can't be bought. How we rank →
How to Know If Your Trucking Business Is Actually Making Money
On this page
We built MileVoxa — the screenshots below are from our own demo account, in free public beta. The math is the point, not the product.
The Friday-night question
Friday night. The week’s done, the truck’s parked, money moved in both directions — a deposit here, a fuel stop there, a repair bill that hurt. You sit down and ask the one question that should have an answer: did I actually make money this week?
Most drivers can’t answer it. Not because the information doesn’t exist — the receipts are in the glove box, the settlements are in the email — but because the numbers never meet each other in one place. The revenue lives in one app, the fuel in a card statement, the repairs in a shoebox, the insurance in a monthly draft. A business whose numbers never collide is a business run on feeling, and feeling is a terrible accountant. This article is the diagnosis: the three numbers that answer the question, the two lies drivers tell themselves instead of answering it, and the whole thing worked live on a real week.
The three numbers that matter
- Real revenue — what actually came in, after factoring fees and anything taken off the top. Not what the load board promised; what landed.
- All-in costs — everything. Fuel, maintenance, tires, tolls, truck payment, insurance, permits, overhead — including the fixed costs that don’t show up on any single load.
- Net — what’s left after all-in costs come off real revenue. This is the only number that answers the Friday-night question.
Everything else — gross per mile, weekly totals, the number of loads you ran — is decoration until it’s been through these three. The rest of this article is about why each of the two lies below gets mistaken for number three.
Lie #1 — “revenue is profit”
The $13,200-week fallacy goes like this: the week grossed $13,200, and somewhere in the driver’s head that number gets filed as “what I made.” It isn’t what he made. It’s what passed through.
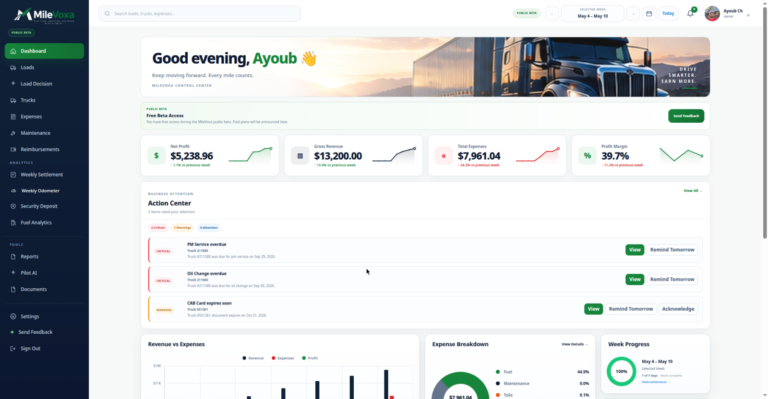
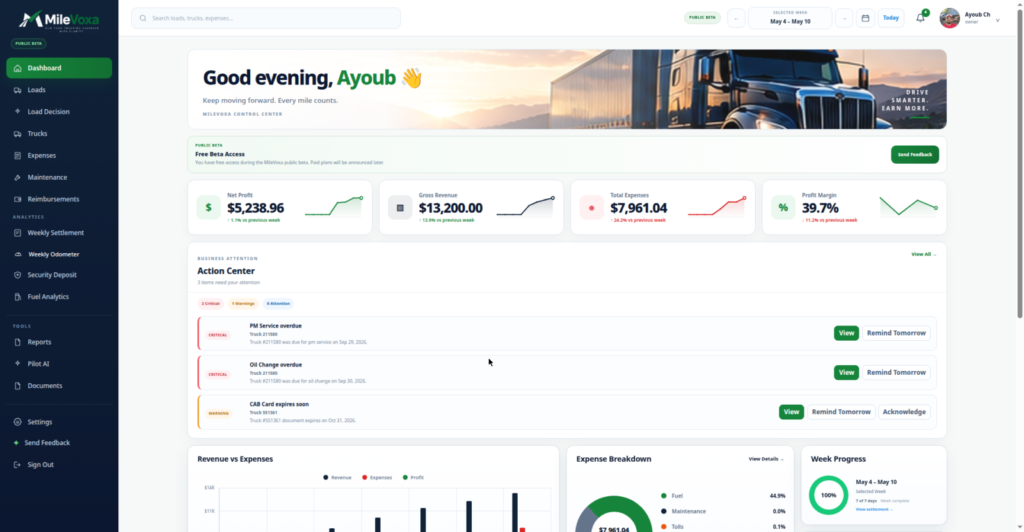
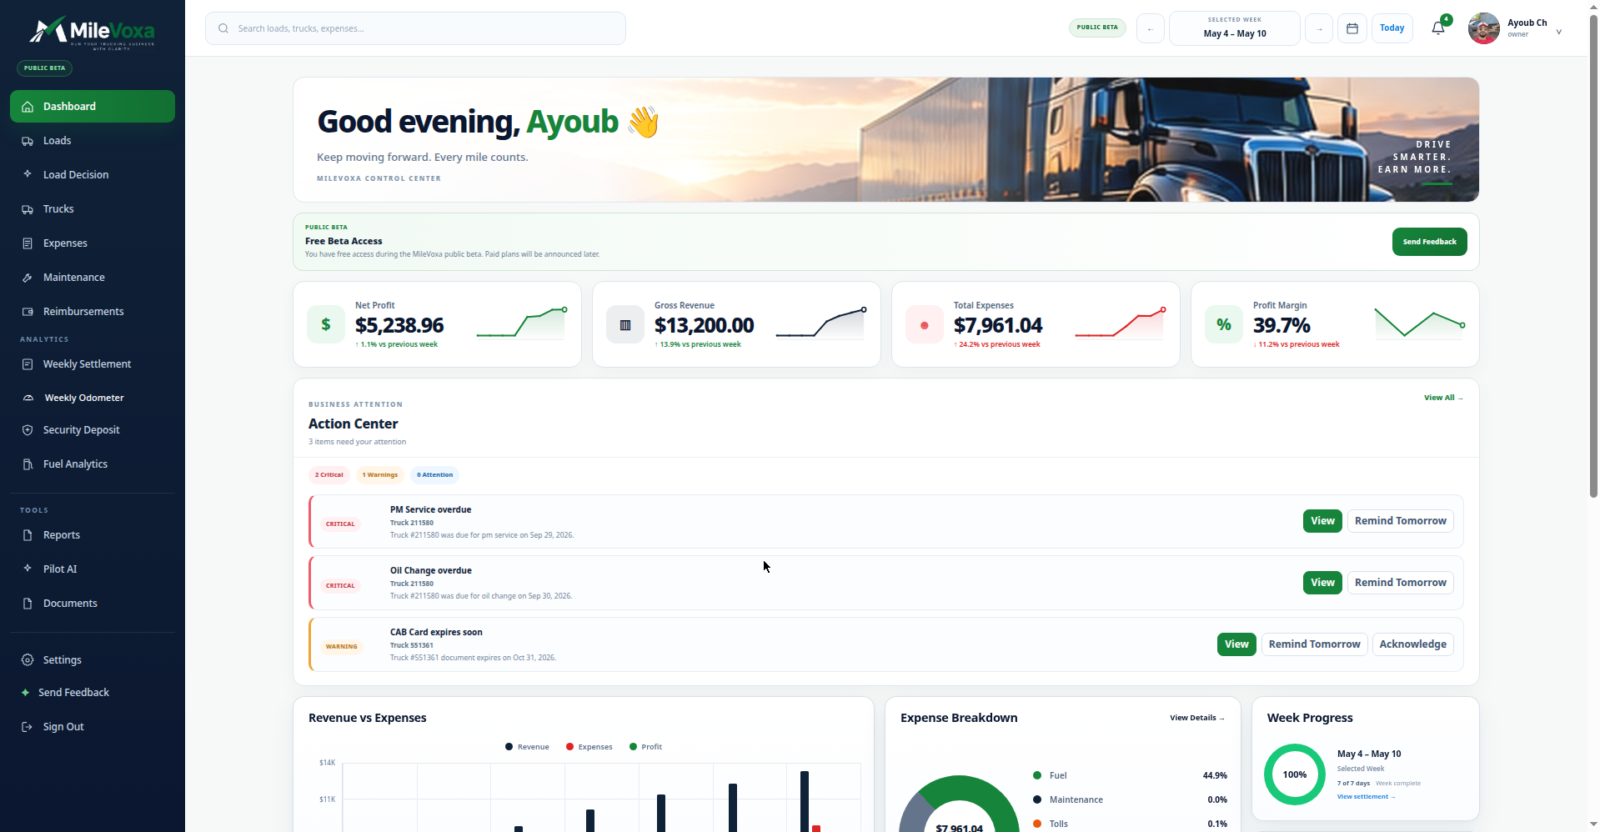
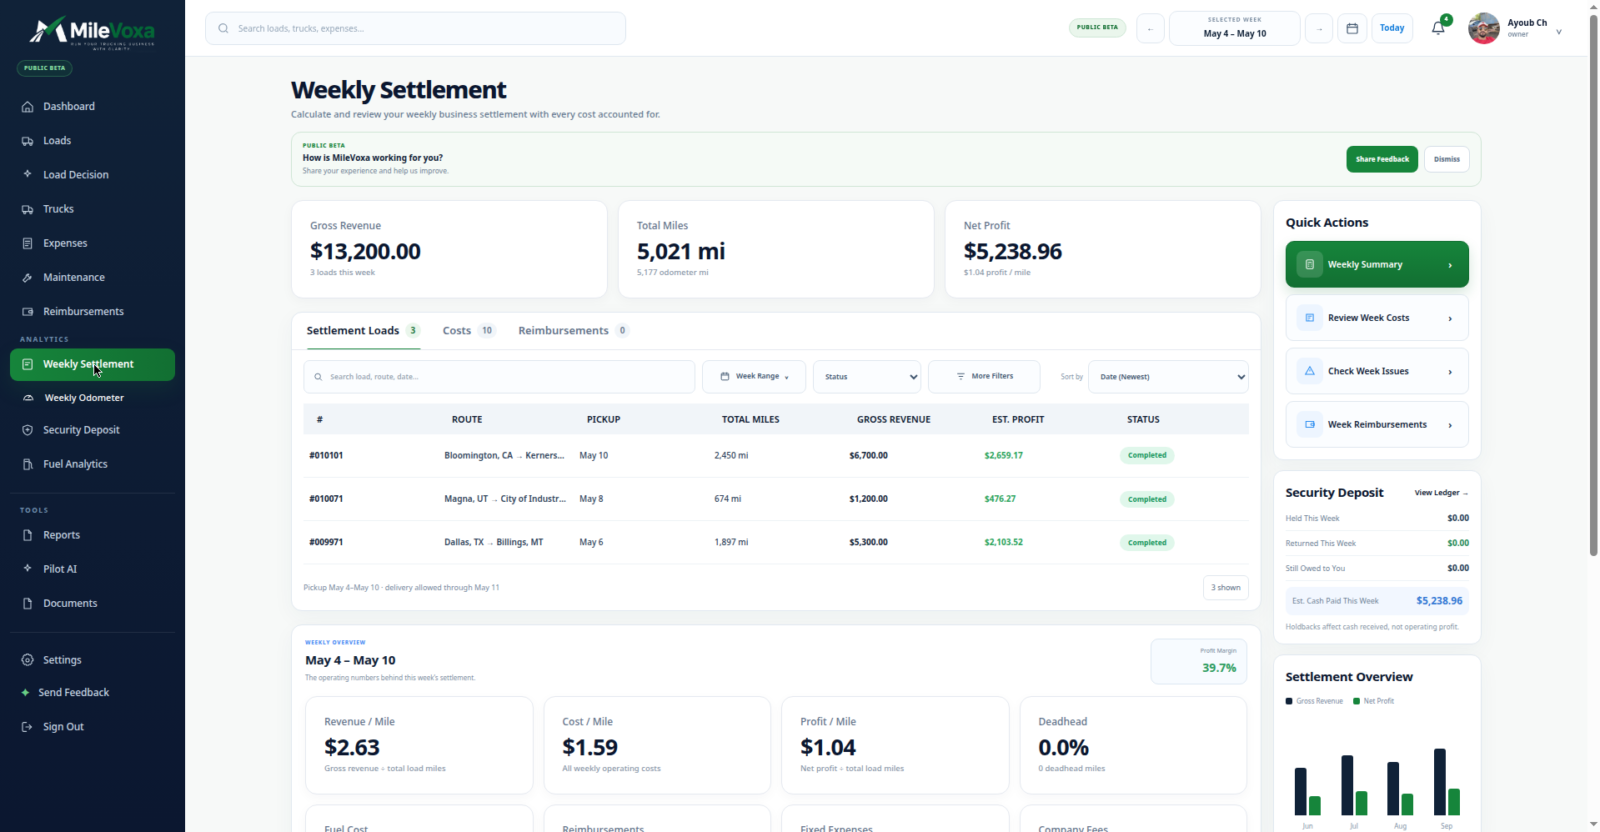
Here’s that same week, run through the math — every figure from our own demo account, the week of May 4–10, 2026. Gross revenue: $13,200.00. Total expenses for the week: $7,961.04 — fuel, truck payment, insurance, maintenance, the rest, all-in. Net profit: $5,238.96. The margin: 39.7%.
$13,200 came in; $5,238.96 stayed. That’s not a bad week — it’s a fine one — but it’s less than half the gross, and a driver who mentally files $13,200 as “the week’s money” will spend accordingly. Gross means nothing until the costs come off. The dashboard screen above shows all three numbers side by side, which is exactly where they should always be: revenue, expenses, and the net that actually answers the question.
Lie #2 — “a profitable load means a profitable week”
This one’s sneakier, because it feels like business sense. You ran three loads, each one paid above your costs, so the week must have been profitable — right? Not necessarily. The Loads screen shows each load’s per-load profit (before fixed costs/overhead) — what that load earned on its own — but the week also carries costs that belong to no single load: the truck payment, the insurance, the overhead. A week of individually profitable loads can still come up short after everything lands. The settlement shows net profit after all expenses — what the week actually kept. Two different numbers, both correct, answering different questions.
The full version of that distinction — with a real week walked line by line, both screens side by side — is in the settlement tutorial. Short version for here: never judge the week by the loads alone. Judge it by the net.
The spreadsheet trap
The founder built MileVoxa after years of watching drivers try to run a business on Excel, paper, or gut feel — his own observation from talking to drivers, not a survey, and it matches what most of us have seen at the fuel island. The receipts exist. The settlement exists. They just never meet each other.
A spreadsheet can hold the numbers; it can’t make them collide. Revenue in one tab, fuel in another, the insurance bill in a folder — and the net profit, the one number that matters, lives nowhere, because nobody built the formula that pulls all three together. That’s the trap: the work of entering numbers feels like bookkeeping, so it feels like enough. It isn’t. Bookkeeping records the past. The diagnosis needs one place where revenue and expenses actually collide and produce the net — computed from the data you entered, not estimated, not guessed.
And the honest caveat, which this article repeats everywhere it belongs: the computation needs your data entered. MileVoxa computes net profit from the revenue and expenses you enter — it can’t compute what you don’t feed it. The tool doesn’t replace the discipline of recording costs. It just makes the discipline pay off.
The diagnosis, worked live
Enough theory. Here’s the diagnosis run inside MileVoxa on real weeks from our own demo account — dashboard, settlement, and Pilot AI, in that order. Every figure below is from our own demo account.
Step one — the dashboard. Week of May 4–10, 2026: Gross Revenue $13,200.00, Total Expenses $7,961.04, Net Profit $5,238.96, profit margin 39.7%. That’s the three numbers that matter, computed from the week’s entered revenue and expenses, sitting on one screen. This is the Friday-night answer, no assembly required.
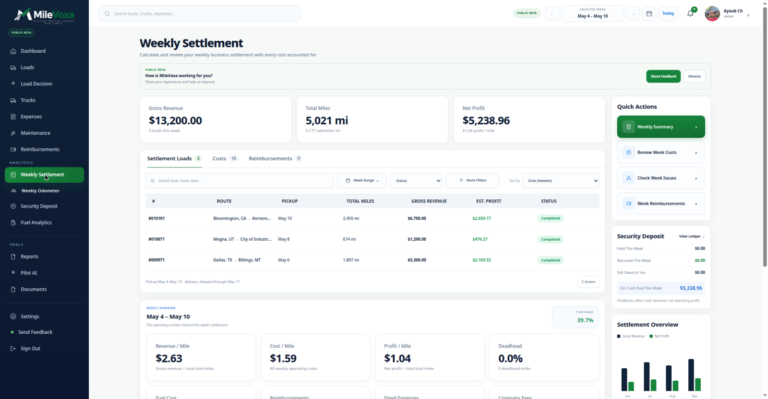
Step two — the settlement. Same week, the weekly settlement confirms the net — $5,238.96 — and adds the per-mile view: Revenue/Mile $2.63, Cost/Mile $1.59, Profit/Mile $1.04. Net profit after all expenses, and the per-mile cost that tells you what each mile actually cost. (The full line-by-line walkthrough of this screen — gross, fuel, reimbursements, fixed expenses, company fees, net — is the settlement tutorial.)
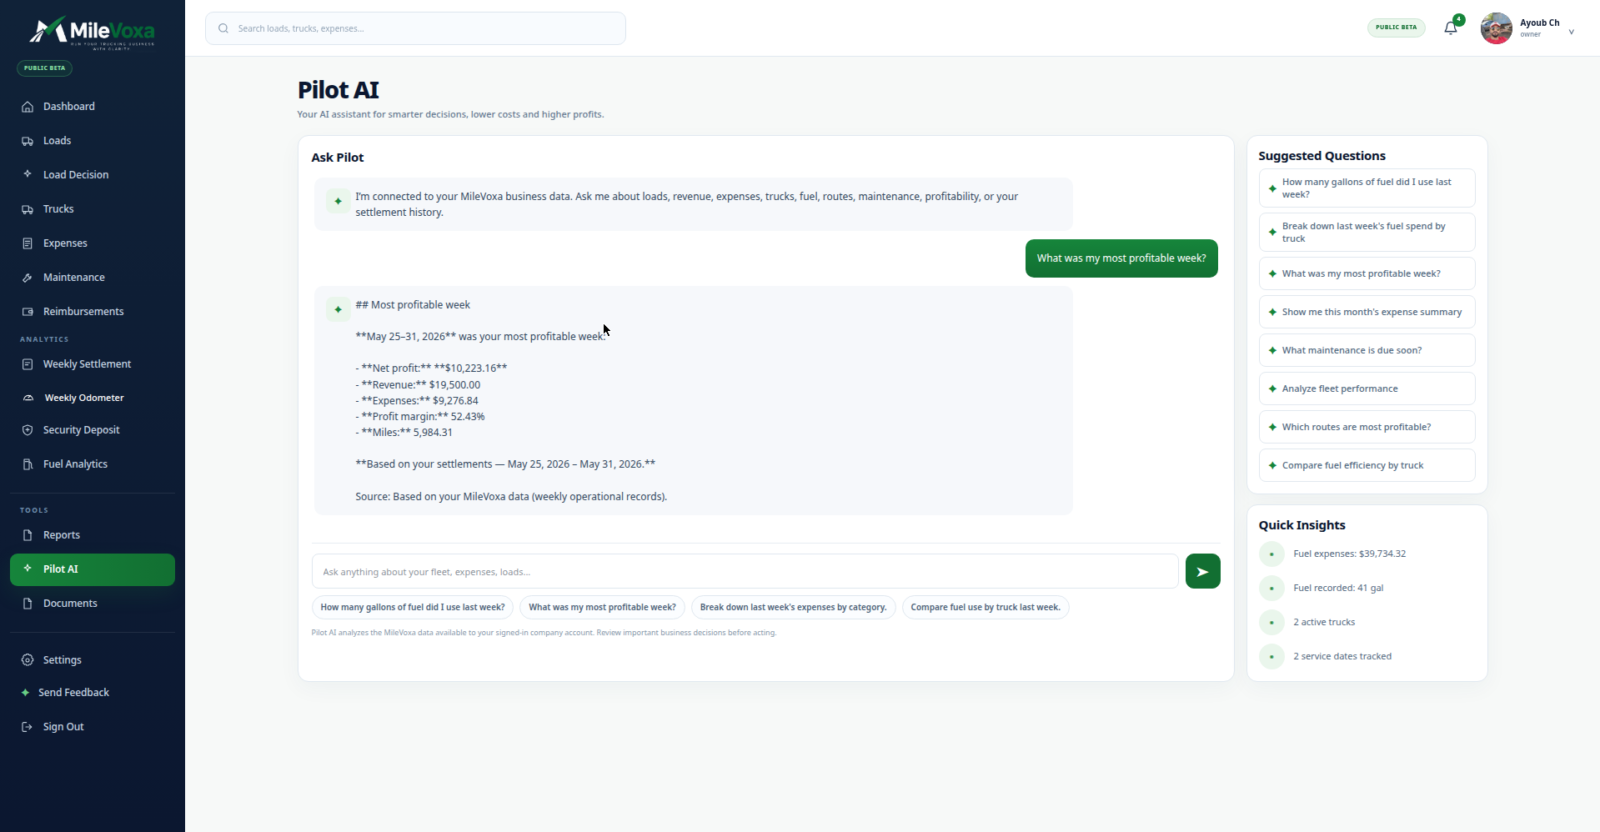
Step three — Pilot AI. Ask it “What was my most profitable week?” and it answers over the account’s own data, with the source stated: “Based on your MileVoxa data (weekly operational records).” Its answer: the week of May 25–31, 2026 — Net profit $10,223.16, Revenue $19,500.00, Expenses $9,276.84, profit margin 52.43%, 5,984.31 miles. All figures from our own demo account — the founder’s own test data, same attribution as everything else in this article. What Pilot AI does here is the collision made conversational: your numbers, queried in plain English, answered with cited figures from your own records.
Notice the two weeks aren’t the same story: $5,238.96 net in the first week, $10,223.16 in the second. That’s not a contradiction — it’s the argument for the weekly habit. One week tells you what happened; a run of weeks tells you what normal looks like and whether you’re moving the right direction. The diagnosis isn’t a one-time event. It’s the Friday-night question, answered every Friday night.
Run your own week through it — try MileVoxa free →
What “profitable enough” looks like
Knowing the net answers “did I make money.” The next question — “is it enough?” — needs benchmarks, and honesty about where benchmarks come from.
FreightWaves’ profit-test framework (their 2024 “The Profit Test Before You Grow” piece, still live) sets two reference points: an all-in cost per mile under $1.70 as ideal for most dry van operations, and a net margin target of at least 20–25%. That’s one framework from one publication for one segment — a benchmark to compare against, not universal law, and it should be cited that way.
Overdrive adds useful context for the margin question: independent owner-operator profit margins run around 40% when the driver’s own pay isn’t counted as a business expense, and around 20% when it is (the S-corp salary version). The framing matters — whether you pay yourself as an expense changes the margin without changing the business.
And here’s where this article refuses to mislead: the demo week’s 39.7% margin beats the FreightWaves 20–25% target — but the demo account has no wage line, so it’s the “self-pay not counted” version of the number. Say that plainly, because an owner-operator comparing his pay-counting margin against the demo’s pay-not-counted margin would draw exactly the wrong conclusion. Benchmarks only work when you’re comparing the same kind of number.
When the numbers say the business is a job with stress — costs too high, rates too low, miles too few for the margin you need — say so. That’s the diagnosis doing its job. A number you ignore is decoration.
When to change something (not “when to quit”)
A bad net isn’t a verdict on the business; it’s the start of the next question. Diagnose before you act:
- Costs too high? Which bucket — fuel, maintenance, fixed? The expense breakdown by category exists for exactly this: you can’t cut what you can’t see.
- Rates too low? Which lane? The per-load profit view shows what each lane actually earned; the losing lane is usually hiding in plain sight.
- Miles too few? Fixed costs don’t shrink when the truck sits. A slow week doesn’t just earn less — it costs more per mile.
Action follows the numbers, in that order. The number tells you where; you decide what.
Then run the diagnosis again. Whatever you changed — renegotiated insurance, dropped the bad lane, cut the deadhead — shows up in the net within a few weeks if it worked. That’s the part the Friday-night question really gives you: not just an answer, but a feedback loop. The driver who checks the net weekly knows within a month whether the fix took. The driver who checks it at tax time knows in April.
FAQ
What profit margin should a trucking business have?
FreightWaves’ profit-test framework targets at least 20–25% net margin for dry van operations — one framework, not law. Overdrive notes independent margins run around 40% when self-pay isn’t counted as an expense, around 20% when it is. Your margin is only comparable to a benchmark when both numbers count the same things.
How do I know if a load is profitable?
Compare the load’s rate per mile against your all-in cost per mile. If the rate beats your cost, the load contributes to the week. But remember Lie #2: individually profitable loads don’t guarantee a profitable week — fixed costs and overhead still have to come off before you know the net.
What’s the difference between gross and net profit in trucking?
Gross is what came in before costs; net is what’s left after all-in costs come off. In the demo week walked above: $13,200.00 gross, $7,961.04 in all-in expenses, $5,238.96 net. Gross is a fact about the market; net is a fact about your business.
How often should I check if my business is profitable?
Weekly. That’s the rhythm the settlement and the dashboard both run on — revenue, expenses, and net for the week, computed from the week’s entered data. One bad week isn’t a diagnosis, but a weekly habit means you catch the trend while there’s still time to act on it.
All product figures from our own MileVoxa demo account — the founder’s own test data, illustrative only, not customer results or typical outcomes. Industry figures: FreightWaves “The Profit Test Before You Grow” (2024); Overdrive (updated ~Sep 2026). MileVoxa is in public beta — pricing will be announced later. Pilot AI figures are demo data, attributed the same as dashboard and settlement figures.
- Independent testing
- No sponsored rankings
- Prices verified October 2026