Reader-supported: no affiliate links active yet — our rankings can't be bought. How we rank →
How to Calculate Cost Per Mile in Trucking (With a Worked Demo Week)

On this page
We built MileVoxa — the software in the screenshots below is ours, in free public beta. That’s not a disclaimer to skip past; it’s the reason this article can show you the math happening inside a worked week from our own demo account — illustrative carrier data, the founder’s own test numbers — instead of another formula on paper.
Every driver knows the feeling: the rate per mile on a load looks good, the week felt busy, and somehow the money still doesn’t stretch. Cost per mile is the number that explains why. It’s the line between hauling freight and paying for the privilege of hauling it — and this article teaches you the formula, then runs it live on that demo week so you can see exactly how the number gets made.
The formula (and why it’s the whole game)
Cost Per Mile = (Fixed Costs + Variable Costs) ÷ All Miles
That’s it. Add up everything the truck cost you for the period, divide by every mile it turned. The result is what each mile costs you to run — before the load pays a cent. If the rate per mile on the load offer is below your cost per mile, you’re not making money on it. You’re subsidizing it.
The reason this one number matters more than any other in the business: everything else is a guess wearing a spreadsheet’s clothing. Revenue per mile tells you what you charged, not what you kept. A good week tells you nothing about a normal week. Cost per mile is the only number that answers the question “how cheap is too cheap for this load?” — and every driver who doesn’t know theirs is pricing loads by feel.

Fixed vs variable — the only split that matters
The industry-standard split goes like this. Fixed costs are the bills that show up whether the truck moves or not: the truck payment, insurance, permits and plates, ELD and software subscriptions, and your overhead (accounting, phone, the office drawer). Variable costs move with the miles: fuel, maintenance, tires, tolls, DEF, factoring fees.
(One precision note, because sources matter here: ATRI itself reports cost line items — its 2026 operational-costs report tracks things like fuel, repair, wages per line — not fixed-versus-variable buckets. The fixed/variable split is the industry’s standard way of teaching it, which is why this article uses it.)
The split matters because the two kinds of costs behave differently when you’re deciding whether to take a load. Variable costs scale with the mile — fuel doesn’t care whose truck it is. Fixed costs are the silent ones: they keep ticking on the days the truck sits, and they don’t show up on a load-by-load basis, which is exactly how they get forgotten. A driver who knows his fuel cost to the penny and has no idea what his insurance costs per mile doesn’t have a cost per mile. He has half of one.
Fuel is almost always the biggest variable bucket, and usually the biggest single line on the whole sheet. In the demo week we’ll walk below, fuel ran $3,576.70 — 44.9% of the week’s total expenses — tracked on the Fuel Analytics screen, which breaks fuel spend by truck, by location, and by vendor. (Honest note on that screen: gallon-level detail has to be entered per fuel expense before average-price and MPG reporting work — the product says so itself on screen, and this demo week didn’t have it. The math needs your data entered; it can’t compute what you don’t feed it. That’s true of every line in this article, and it’s the one caveat worth repeating twice.)
The deadhead mistake (count ALL miles)
Here’s the mistake that quietly kills more owner-operator math than any other: dividing by loaded miles only. Empty miles burn the same fuel, wear the same tires, and take the same time as loaded miles. Every mile the truck turns costs you. Leave the deadhead out of the denominator and your cost per mile comes out artificially low — which makes every marginal load look profitable right up until the bank statement arrives.
Industry standard, no dispute: total operating costs divided by all miles driven, deadhead included. And here is the cautionary tale, from our own demo week: the settlement screen’s Deadhead line reads 0.0%, but the week’s own mile counts — 5,021 load miles against 5,177 odometer miles — say 156 of those miles ran empty. That is 3.0% deadhead. The screen’s Cost/Mile line reads $1.59 because it divides by the load miles; divide the same costs by all 5,177 miles and you get $1.54. Count the deadhead — and check it against the odometer, not the label. The honest number is the only one that’s useful.


A demo week, worked live
The formula is three lines. Here’s what it looks like with numbers inside it — the week of May 4–10, 2026, from our own demo account. Illustrative Carrier Data: the figures in this section are the founder’s own test data in that demo account — not a customer’s week, and not typical results. Your numbers will differ; the method won’t.
The dashboard for the week shows the three inputs the formula needs, side by side: Gross Revenue $13,200.00, Total Expenses $7,961.04, and the result, Net Profit $5,238.96 — a 39.7% profit margin. The expense breakdown donut splits the $7,961.04 by category: fuel at 44.9% ($3,576.70), truck payment, insurance, the rest. Every figure in this paragraph is from our own demo account.
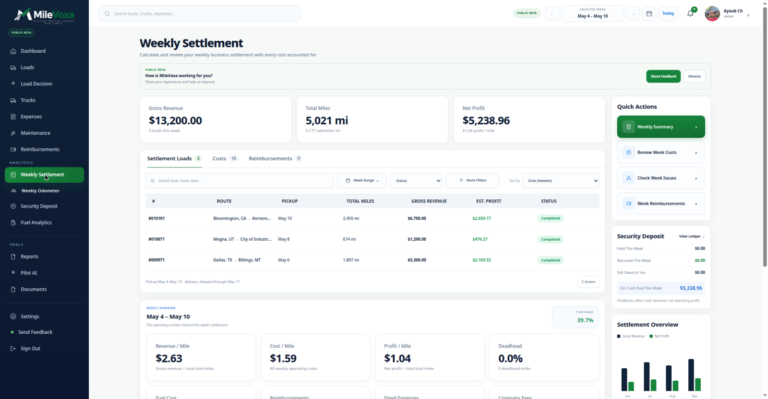
Now the per-mile math, from the weekly settlement screen for the same week. The screen labels its own terms, and they’re the best definitions in this article:
- Revenue/Mile: $2.63 — “Gross revenue ÷ total load miles”
- Cost/Mile: $1.59 — “All weekly operating costs” (the screen divides by load miles; on all miles it is $1.54 — worked in the math below)
- Profit/Mile: $1.04 — “Net profit ÷ total load miles”
The week ran 3 loads, 5,021 load miles and 5,177 odometer miles — 156 empty miles, 3.0% deadhead — figures again from our own demo account. So the formula worked out the way this article teaches it, all miles counted, looks like this: $7,961.04 in all-in costs ÷ 5,177 miles = $1.54 per mile. That’s what each mile cost that week. Every load paying above $1.54 contributed to the week; anything below it would have been hauled at a loss.
Two things worth saying about context, because a bare number misleads. First, if you’ve seen ATRI’s 2026 report figure — total marginal cost of $2.336 per mile in 2025, up 3.4%, $1.854 per mile excluding fuel — don’t read that as “the demo week is cheap” or “my number should be $2.33.” ATRI builds its number from fleet data including driver wages and benefits (wages $0.818 plus benefits $0.210 — $1.028 per mile of that total, per the report). An owner-operator who isn’t counting a wage line — and many don’t — will land well under ATRI. The report is the industry yardstick, not your target.
Second, FreightWaves’ profit-test framework (2024, still the reference piece on this) puts “under $1.70 per mile all-in” as ideal for most dry van operations. That’s one framework for one segment — not universal law, and dry van specifically — but it’s a useful second reference point next to your own number. Attribute it, don’t worship it: it’s a benchmark to compare against, not a promise.
What to do with your number (the yes/no load test)
Once you know your all-in cost per mile, load decisions get simple — not easy, but simple. The rule of thumb: if the load’s rate per mile is below your cost per mile, you are paying them to haul their freight. No amount of “but it’s on the way” or “but I need the miles” changes the arithmetic. Miles below your cost don’t fill the week; they empty the account.
This is why cost per mile is a load-acceptance filter first and a report second. The demo week’s $1.54 is the line that week: a $2.00/mi load is worth a conversation; a $1.40/mi load is a donation. Run the number weekly — it moves with fuel prices, repair seasons, and how much deadhead you ran — and keep it somewhere you can see it before you tap “accept.” (Where those numbers land every week — gross, costs, net, per-mile — is what the weekly settlement screen is for; the settlement tutorial walks one line by line.)
The traps (what the formula hides)
The formula is honest. The inputs lie, and here’s how.
The maintenance reserve. Maintenance is lumpy — nothing for months, then a $4,000 repair — and the weeks with nothing in them lie to you. The standard discipline, from the same FreightWaves profit-test framework, is to set aside a monthly maintenance reserve even in the clean months: they suggest $0.10 per mile as a starting habit. It’s not your actual maintenance cost; it’s the habit that keeps a clean month from lying to you about what the truck really costs.
Annual costs divided by 12. Permits, annual insurance premiums, the HVUT — the big once-a-year bills. If your cost-per-mile period is a week or a month, these show up as zero most of the time and as a catastrophe once a year. Divide each annual cost by 12 (or 52) and feed the slice into every period. The week you pay the insurance bill shouldn’t be the week you discover the truck costs more than you thought.
One bad month isn’t your cost per mile. A blown turbo, a week of breakdowns, a slow freight stretch — any single period can spike the number. Run it over rolling weeks or months before you let it change your decisions. The number is a compass, not a verdict on one bad stretch.
The missing data. Every section above assumes the expenses are actually entered — all of them, including the boring ones. A cost-per-mile built from fuel and truck payment only is a fantasy with two inputs. The software computes net profit from the revenue and expenses you enter; it can’t compute what you don’t feed it. The cheapest way to get a wrong number is to skip the receipts.
FAQ
What is a good cost per mile for an owner-operator?
It depends on your operation — equipment, insurance, lanes, deadhead. ATRI’s 2026 report puts the industry fleet average at $2.336 per mile (2025, including driver wages), which isn’t a target so much as the industry’s yardstick. FreightWaves’ profit-test framework puts under $1.70 per mile all-in as ideal for most dry van operations — one framework, not law. Your own number, run honestly with all miles counted, is the only one that matters for your decisions.
Should deadhead miles count in cost per mile?
Yes — always. Empty miles cost the same as loaded miles: same fuel, same wear, same driver time. Dividing by loaded-only miles flatters the number and makes marginal loads look profitable when they aren’t. Industry standard is total operating costs ÷ all miles driven, deadhead included.
Fixed vs variable costs — what’s the difference?
Fixed costs show up whether the truck moves or not (truck payment, insurance, permits, overhead). Variable costs scale with the miles (fuel, maintenance, tires, tolls, DEF). You need both for an honest cost per mile — and the fixed ones are the ones most often forgotten, because they don’t appear on any single load.
How often should I recalculate?
Weekly. That’s the rhythm the settlement and the dashboard both run on — revenue, expenses, and net for the week, computed from the week’s entered data. Just don’t let one bad week rewrite your judgment; look at the rolling trend, not the outlier.
Figures from our own MileVoxa demo account (week of May 4–10, 2026) are illustrative — they’re the founder’s own test data, not customer results, and your numbers will differ. Industry figures: ATRI 2026 Analysis of the Operational Costs of Trucking (released July 15, 2026); FreightWaves “The Profit Test Before You Grow” (2024). MileVoxa is in public beta — pricing will be announced later.
- Independent testing
- No sponsored rankings
- Prices verified November 2026